La Niña
[ad_1]
La Niña is a climate pattern that describes the cooling of surface-ocean waters along the tropical west coast of South America. La Niña is considered to be the counterpart to El Niño, which is characterized by unusually warm ocean temperatures in the equatorial region of the Pacific Ocean.
Together, La Niña and El Niño are the “cold” (La Niña) and “warm” (El Niño) phases of the El Nino-Southern Oscillation (ENSO). ENSO is series of linked weather– and ocean-related phenomena. Besides unusually warm or cool sea-surface temperatures, ENSO is also characterized by changes in atmospheric pressure.
La Niña events sometimes follow El Niño events, which occur at irregular intervals of about two to seven years. The local effects on weather caused by La Niña (“little girl” in Spanish) are generally the opposite of those associated with El Niño (“little boy” in Spanish). For this reason, La Niña is also called anti-El Niño and El Viejo (the old man in Spanish).
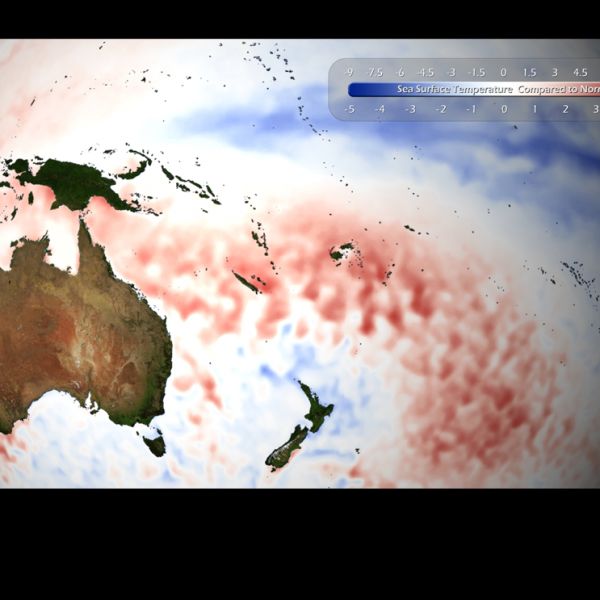
Scientists use the Oceanic Nino Index to measure the deviations from normal sea-surface temperatures that El Niño and La Niña produce in the east-central Pacific Ocean. La Niña events are indicated by sea-surface temperature decreases of more than 0.5 degrees Celsius (0.9 degrees Fahrenheit) for at least five successive three-month seasons.
La Niña is caused by a build-up of cooler-than-normal waters in the tropical Pacific, the area of the Pacific Ocean between the Tropic of Cancer and the Tropic of Capricorn. Unusually strong, eastward-moving trade winds and ocean currents bring this cold water to the surface, a process known as upwelling. Upwelling can cause a drastic drop in sea-surface temperature.
Coastal sea-surface temperatures near Ecuador and Peru dropped nearly 4 degrees Celsius (7 degrees Fahrenheit) during the 1988-89 La Niña event.
Effects of La Niña
Both El Niño and La Niña affect patterns of rainfall, atmospheric pressure, and global atmospheric circulation. Atmospheric circulation is the large-scale movement of air that, together with ocean currents, distributes thermal energy on the surface of Earth. These changes are the main sources of variability in climate for many areas worldwide.
La Niña is characterized by lower-than-normal air pressure over the western Pacific. These low-pressure zones contribute to increased rainfall. Rainfall associated with the summer monsoon in Southeast Asia tends to be greater than normal, especially in northwest India and Bangladesh. This generally benefits the Indian economy, which depends on the monsoon for agriculture and industry. However, strong La Niña events are associated with catastrophic floods in northern Australia. The 2010 La Niña event correlates with one of the worst floods in the history of Queensland, Australia. More than 10,000 people were forced to evacuate, and damage from the disaster was estimated at more than two billion dollars.
La Niña events are also associated with rainier-than-normal conditions are over southeastern Africa and northern Brazil. La Niña is also characterized by higher-than-normal pressure over the central and eastern Pacific. This results in decreased cloud production and rainfall in that region. Drier-than-normal conditions are observed along the west coast of tropical South America, the Gulf Coast of the United States, and the pampas region of southern South America.
La Niña usually has a positive impact on the fishing industry of western South America. Upwelling brings cold, nutrient-rich waters to the surface. Nutrients include plankton eaten by fish and crustaceans. Higher-level predators, including high-value fish species such as sea bass, prey on the crustaceans.
La Niña events may last between one and three years, unlike El Niño, which usually lasts no more than a year. Both phenomena tend to peak during the Northern Hemisphere winter.
Monitoring La Niña
Scientists collect data about El Niño and La Niña using a number of technologies. The National Oceanic and Atmospheric Administration (NOAA), for instance, operates a network of buoys which measure sea-surface temperature, air temperature, currents, winds, and humidity. The buoys are located in about 70 locations, from the Galapagos Islands to Australia. These buoys transmit data to researchers and meteorologists every day.
Using buoy data in conjunction with visual information they receive from satellites, scientists are able to more accurately predict ENSO and visualize its development and impact around the globe.